

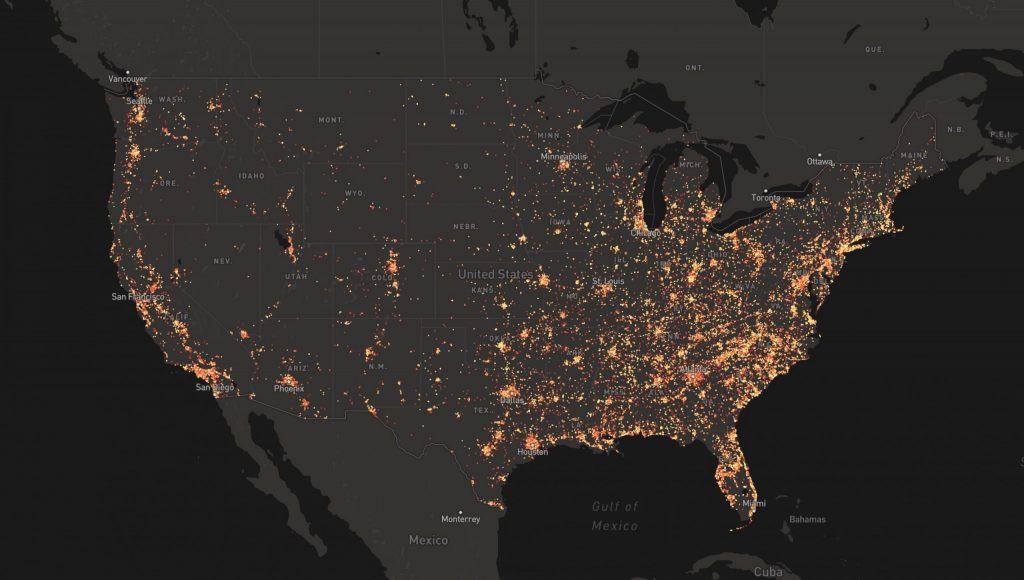
Earlier this December, The Trace published a map of more than 150,000 shootings that have occurred in America over the past five years. We created the tool because we believe that making data intimate and accessible — while also situating it in the bigger picture — is a powerful way to illustrate a vast and complex issue like gun violence. The map is powered by data collected by Gun Violence Archive, a nonprofit site that tracks incidents of gun violence in the United States.
The map showed us things we hadn’t realized about gun violence. Our readers learned things from it, as well.
Using the map’s search function, you can see the shootings that Gun Violence Archive has documented for an entire city or state, or within a mile of a specific address. Zoom in all the way, and you see the incidents scarring a single block; zoom out, and the urban areas that suffer gun violence’s disparities glow with the markers of a half-decade of violence.
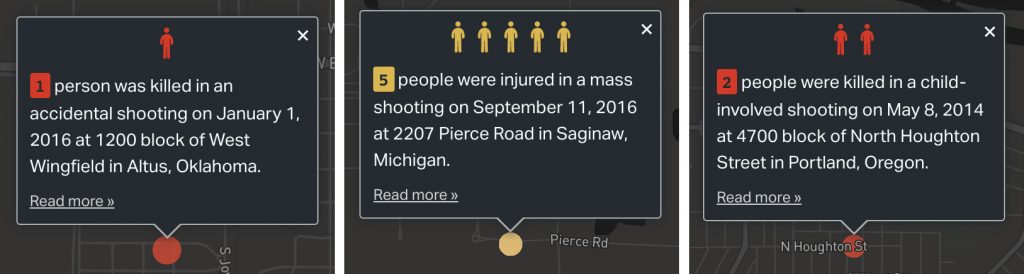
Clicking on a point allows you to view the essential details of the specific incident. Every shooting has a story behind it, and the overwhelming majority of them don’t make national news. More detailed incident reports are available at Gun Violence Archive.
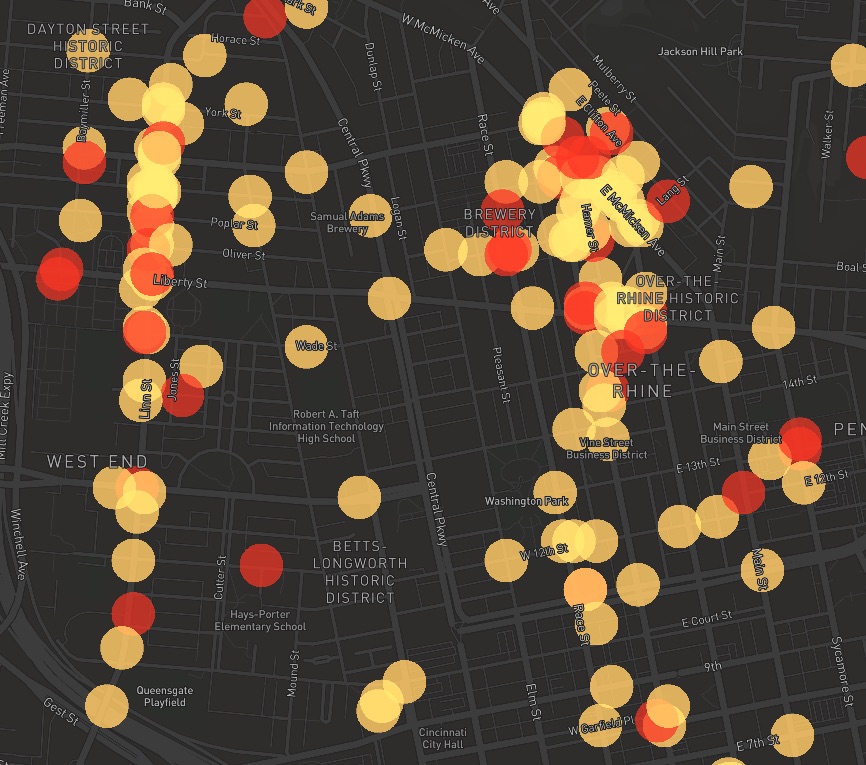
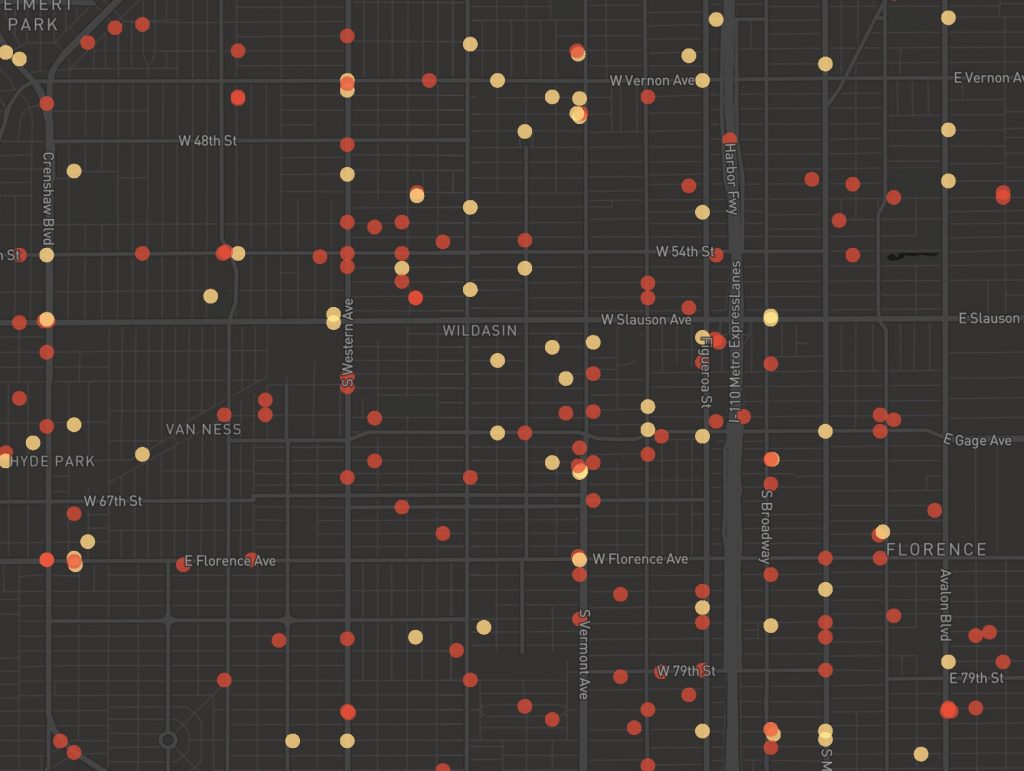
Mapping shootings this way reveals the patterns of gun violence, but there are important things it doesn’t convey. In particular, the map doesn’t indicate per capita rates of gun violence, which are the best way to understand relative amounts of violence across cities or states. Compare Los Angeles to Cincinnati: the map shows about 950 shootings for each city. But LA’s population is more than a dozen times greater than Cincinnati’s, so those shootings are distributed throughout a much larger group of people.
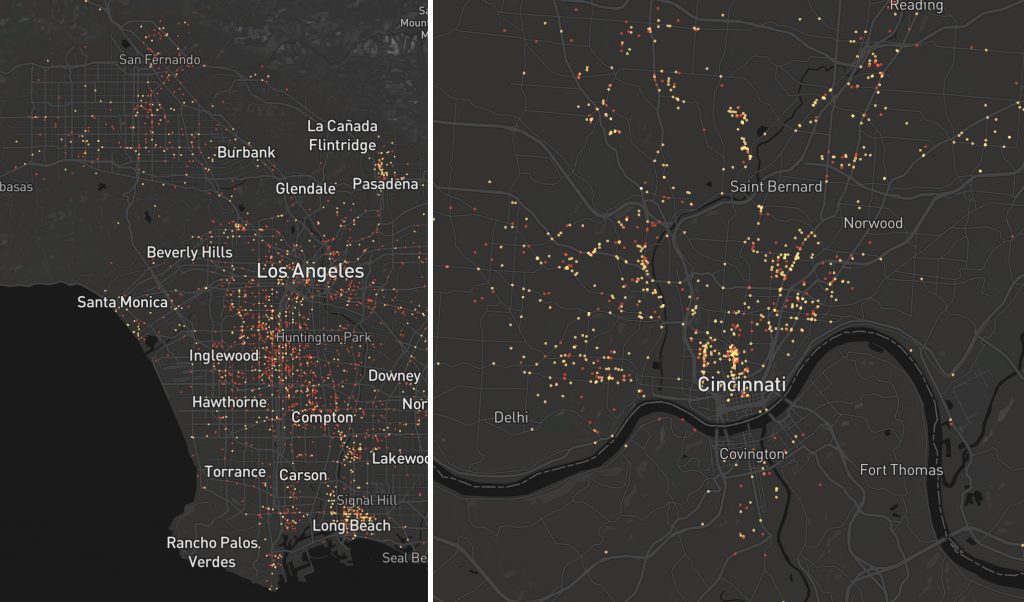
But rates, in turn, can have their own limitations, failing to capture the geographic inequalities of gun violence. Our map reveals the neighborhoods and blocks where shootings cluster, and the ones that are relatively free from violence. Zooming into Cincinnati, dense groups of incidents are apparent in two of the city’s most violent neighborhoods.
In the sprawl of Los Angeles, no such clusters are found. These views illustrate the character of urban violence in a way that a less granular map could not.
To the general public, no place in America is more strongly associated with gun violence than Chicago. The city has recorded some 12,500 gun homicides, assaults, and accidental shootings since 2014 — more than the entire state of California. Clustered along blocks and intersections, the incidents overlay Chicago’s urban grid. In some neighborhoods, gun violence is so densely concentrated that few locations are farther than a couple blocks from the nearest shooting.
Washington, D.C., had the 17th-highest murder rate among major American cities in 2017. Over the past five years, the city recorded more than 1,700 shootings. At least 62 happened within one mile of the Capitol.
Article Read Time
Avg Reading Time: 3.6 Minutes